Tracker is the result of more than 5 years of development. It has undergone many changes and improvements to become what it is today. In this first part of a series of articles, I will explore how the project began.
The inspiration
In late 2015, I was curious about the number and density of Wi-Fi networks in the city centre. I wanted to know how many networks there were in different locations and how congested the 2.4GHz frequency was. I also wanted to try Android development, so this was a perfect opportunity. I paid the Play Store fee and released my first beta version of the app on November 14, 2015.
I never expected it to grow so much in scope. It may not seem like it, but it is not a simple application. Codacy estimates it has 46 thousand lines of code as of version 2020.1.
The initial design
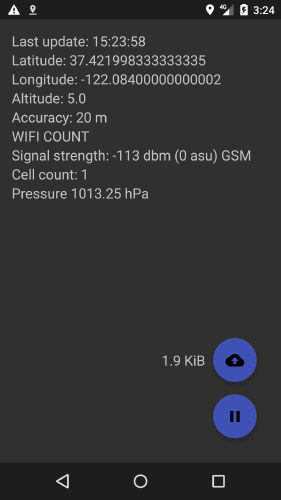
Tracker started as a client-server application. The Android app was called “Signal collector” and the Windows console app was called “Signal processor”. The Android app was very basic and collected data about cell networks, Wi-Fi networks and humidity. For the first few months of development, the server was just a console app that had to be manually run. Data had to be manually copied from the Android app to the server. I chose the client-server model because I thought mobile devices would struggle with all the calculations involved. I also liked the idea of allowing people to collaborate on collecting data.
The awful client
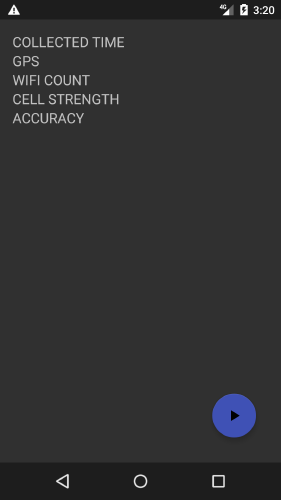
The first version I made was flawed in every way. I had no clue how to create Android apps, so I relied on tutorials. But because I didn’t know what I was looking for, I ended up using outdated tutorials and implementing some features incorrectly. For example, tracking was not a service, but just ran on the app’s main thread. This had two major drawbacks. First, the logic blocked the UI. Second and even worse, the tracking stopped when the screen was off.
I added a service soon after because it was just unusable. It also became clear that there had to be an auto-tracking feature. Even I, who was very interested in the data, often forgot to turn on the tracking. Fortunately, Google had already developed a solution for my problem—the Activity Tracking API. At that time, it didn’t even need a foreground service to keep active.
At first, data was saved in memory and then serialized to JSON and saved to a file. This wasn’t an optimal solution. The serialization took a long time and ran on the UI thread. Every time the tracking stopped, the app froze for seconds or even minutes. It didn’t take long before I replaced it with partial serialization. Partial serialization serialized each collection (or a small number of collections) right after they were done and appended them to a file. This approach was used until version 3, but it was significantly improved. In theory, this approach is great, but unfortunately, there were many problems when unexpected situations occurred. These problems often corrupted the files, so the server had to fix these problems if possible. Unfortunately, not every file could be fixed automatically, so some files were deleted or manually fixed. Version 4 replaced it with SQLite database.
The basic server
The server that created the map was a command-line app that had to be manually run. It created a simple map with iconic square grid colours. I hope to bring back this feature in a future update as a kind of easter egg. It may seem simple, but it was quite challenging to get right. Some of the issues I faced were: matching data with the correct tile and position on it, scaling each tile to the real-world size,1 drawing data that was only partially present on a given tile and so on. Most of these issues come from the fact that projecting a sphere (Earth is not exactly a sphere, but close) to a rectangle is tricky.
Client improvements
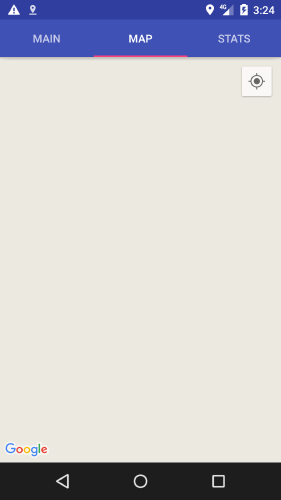
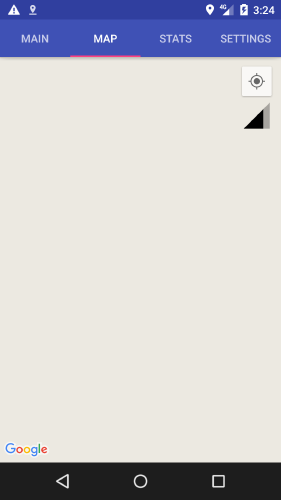
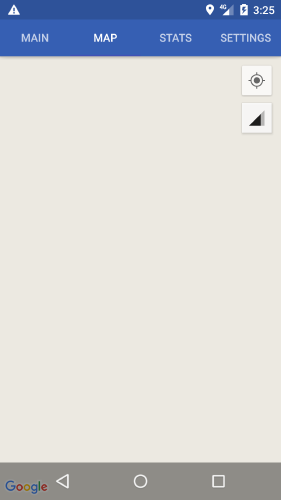
The Android client underwent many enhancements over the next few months, such as adding an in-app map (which worked), stats (which did nothing for a while) and settings.
The screenshots show a blank map because they were taken with an archived version, which no longer has valid map API keys.
It was very tedious to export data manually, so I decided to create a small PHP web app. This small app also provided access to the web tiles and allowed users to see them on the web.
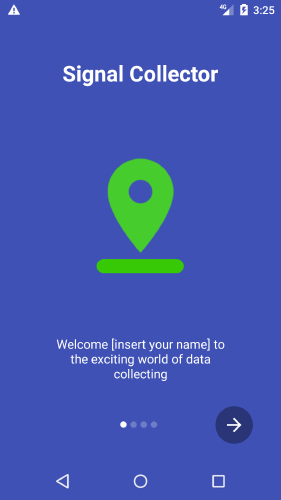
Around the same time, I also introduced an app onboarding, to help new users learn how the Android app works.
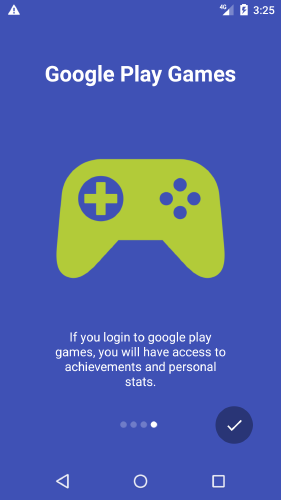
After months of development, I finally had the app I wanted to create. But it still felt incomplete. There was nothing to motivate users to use their devices and batteries to collect data. Most people are not very interested in electromagnetic signals in their surroundings. At the time, Google Play Games seemed like an interesting option. Users would be able to compete with each other using leaderboards and earn achievements based on milestones. While it sounded good on paper, it just didn’t work when there were few users. For that reason, I decided to scrap leaderboards very early on.
This experiment marked the app as a game forever. Before re-release under a different package name, Samsung’s Game Tools thought it was a game, even though it was long marked as a tool.
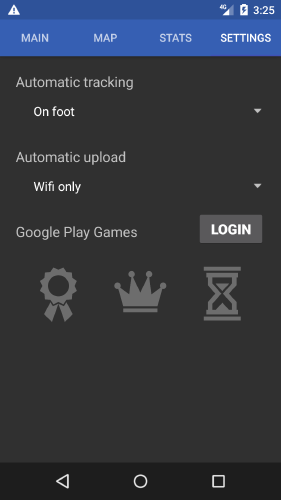
Over time the Android app became more polished and I started preparing for open beta and eventual release. Little did I know that it would take a few more years, before an actual public release.
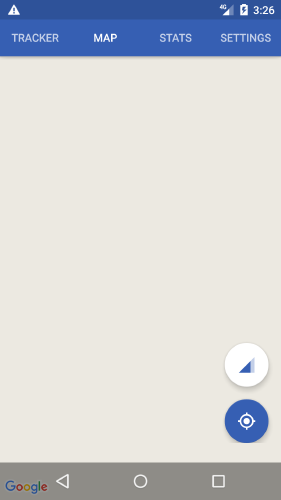
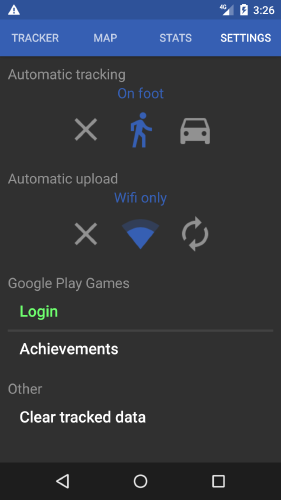
The design of the app got much-needed improvements with the addition of cards and a switch from generic blue to green theme colour. All of these changes helped make the app more readable and easier to use.
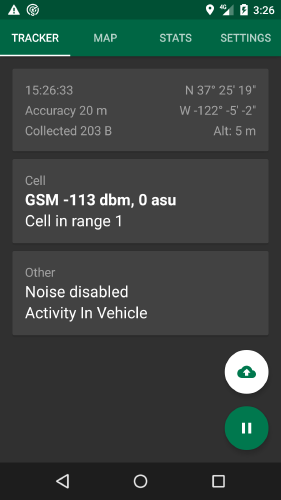
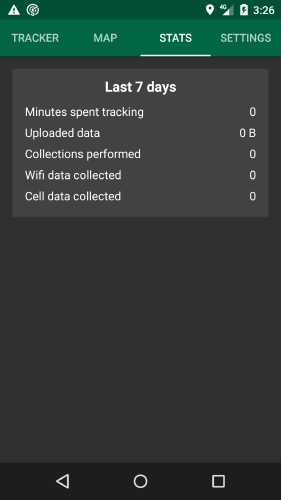
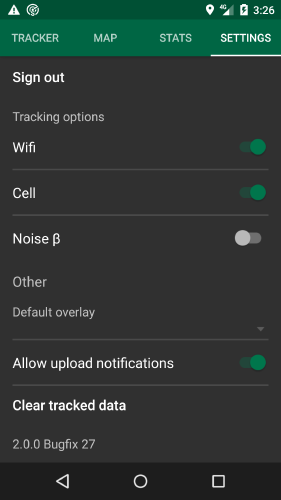
The first generation used different maps API keys, which are no longer valid, so the maps are blank. The settings did not use Preferences which are used today. Client-Server communication was done without any encryption because most web hosting providers wanted a lot of money for HTTPS and certificates at the time. Luckily as time went by, HTTPS became much more convenient and cheaper (thanks to Let’s Encrypt) to implement.
Noise
In the early days, I tried to track not only pressure but also noise. Tracking noise is actually a really cool idea. Unfortunately, I realized, it would be very hard to implement correctly. I hoped that Android’s built-in noise reduction and simple wave analysis would be enough to generate a reasonable estimate of the noise. Sadly, it is not enough. The noise reduction does not properly eliminate the noise when inside the pocket, and clothing can sometimes be louder than the actual background noise. In the end, I decided to drop the idea.
The second generation
Read on about the second generation. During the second generation the app received UI improvements, experimental features and complete codebase rewrite to Kotlin.
-
Tile was supposed to be a square with a side length of 30 meters. Unfortunately, this is not as simple as just scaling the square by zoom amount as maps are distorted. 30 meters at the equator and near the pole are very different when converted to pixels. For more information, see Wikipedia Mercator projection article https://en.wikipedia.org/wiki/Web_Mercator_projection. ↩︎